- Virgin Media Community
- Forum Archive
- Re: High packet loss with odd behaviour
- Subscribe to RSS Feed
- Mark Topic as New
- Mark Topic as Read
- Float this Topic for Current User
- Bookmark
- Subscribe
- Mute
- Printer Friendly Page
High packet loss with odd behaviour
- Mark as New
- Bookmark this message
- Subscribe to this message
- Mute
- Subscribe to this message's RSS feed
- Highlight this message
- Print this message
- Flag for a moderator
on 26-11-2022 14:33
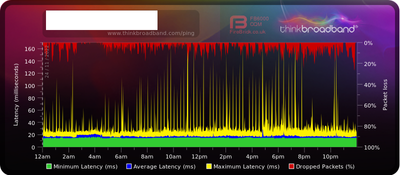
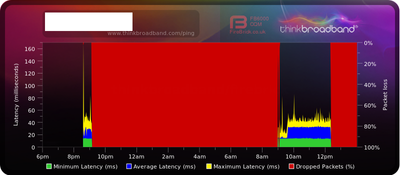
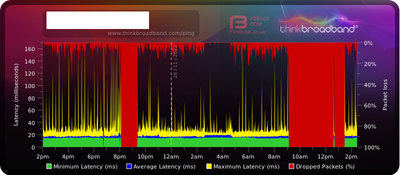
I had reason to check the BQM for my connection the other day and noticed that there was a substantial amount of packet loss.
Note that between ~3am and 4am the packet loss goes away? That happens *EVERY* night. Exactly the same behaviour (sometimes a little longer, sometimes shorter but the same pattern).
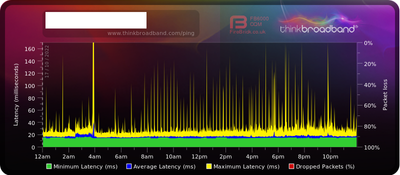
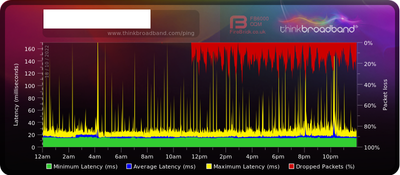
Checking back and this started 18th Oct (we were actually away on holiday that week)
17/10/2022
18/10/2022
19/10/2022
I run my Hub3 in modem mode, hanging off it is a pfSense router. To eliminate potential issues I turned the modem back to router mode...Which confuses things even more (ignore the sea of red, that was when it was in modem mode). No packet loss showing.
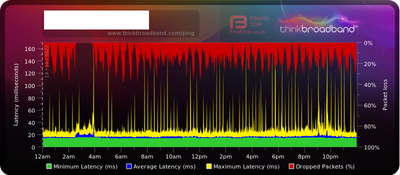
Swap back to modem mode... Packet loss (again, ignore the sea of red).
At this point I'm at something of a loss. I'm stuck in that it's obviously something has "changed" (and it happened while I was on holiday as well) *and* there is obviously something odd on at 3-4am *but* rather concerned that VM will just fob me off with a "well it works in router mode" and charge me for a call out.
The Hub3 has some "Pre RS Errors" but no "Post RS Errors"
Downstream bonded channels
Channel Frequency (Hz) Power (dBmV) SNR (dB) Modulation Channel ID
| 1 | 451000000 | 7.3 | 40 | 256 qam | 40 |
| 2 | 331000000 | 8 | 40 | 256 qam | 25 |
| 3 | 339000000 | 8.3 | 40 | 256 qam | 26 |
| 4 | 347000000 | 8.4 | 40 | 256 qam | 27 |
| 5 | 355000000 | 8 | 40 | 256 qam | 28 |
| 6 | 363000000 | 8 | 40 | 256 qam | 29 |
| 7 | 371000000 | 7.8 | 40 | 256 qam | 30 |
| 8 | 379000000 | 7.4 | 40 | 256 qam | 31 |
| 9 | 387000000 | 7.3 | 40 | 256 qam | 32 |
| 10 | 395000000 | 7.4 | 40 | 256 qam | 33 |
| 11 | 403000000 | 7.5 | 40 | 256 qam | 34 |
| 12 | 411000000 | 7.5 | 40 | 256 qam | 35 |
| 13 | 419000000 | 7.3 | 40 | 256 qam | 36 |
| 14 | 427000000 | 7.3 | 40 | 256 qam | 37 |
| 15 | 435000000 | 7.1 | 40 | 256 qam | 38 |
| 16 | 443000000 | 7 | 40 | 256 qam | 39 |
| 17 | 459000000 | 7.4 | 40 | 256 qam | 41 |
| 18 | 467000000 | 7.5 | 40 | 256 qam | 42 |
| 19 | 475000000 | 7.5 | 40 | 256 qam | 43 |
| 20 | 483000000 | 7.4 | 40 | 256 qam | 44 |
| 21 | 491000000 | 6.9 | 40 | 256 qam | 45 |
| 22 | 499000000 | 7 | 40 | 256 qam | 46 |
| 23 | 507000000 | 6.5 | 40 | 256 qam | 47 |
| 24 | 515000000 | 6.5 | 40 | 256 qam | 48 |
Downstream bonded channels
Channel Locked Status RxMER (dB) Pre RS Errors Post RS Errors
| 1 | Locked | 40.3 | 4 | 0 |
| 2 | Locked | 40.9 | 0 | 0 |
| 3 | Locked | 40.9 | 5 | 0 |
| 4 | Locked | 40.9 | 5 | 0 |
| 5 | Locked | 40.3 | 6 | 0 |
| 6 | Locked | 40.9 | 4 | 0 |
| 7 | Locked | 40.3 | 5 | 0 |
| 8 | Locked | 40.3 | 5 | 0 |
| 9 | Locked | 40.3 | 5 | 0 |
| 10 | Locked | 40.9 | 6 | 0 |
| 11 | Locked | 40.3 | 5 | 0 |
| 12 | Locked | 40.3 | 5 | 0 |
| 13 | Locked | 40.3 | 5 | 0 |
| 14 | Locked | 40.3 | 5 | 0 |
| 15 | Locked | 40.9 | 5 | 0 |
| 16 | Locked | 40.3 | 6 | 0 |
| 17 | Locked | 40.3 | 4 | 0 |
| 18 | Locked | 40.3 | 18 | 0 |
| 19 | Locked | 40.9 | 5 | 0 |
| 20 | Locked | 40.3 | 6 | 0 |
| 21 | Locked | 40.3 | 0 | 0 |
| 22 | Locked | 40.3 | 20 | 0 |
| 23 | Locked | 40.3 | 2 | 0 |
| 24 | Locked | 40.3 | 6 | 0 |
The router *isn't* (as far as I can tell) showing errors on the port (output in next reply).
Any suggestions or recommendations?
- Mark as New
- Bookmark this message
- Subscribe to this message
- Mute
- Subscribe to this message's RSS feed
- Highlight this message
- Print this message
- Flag for a moderator
on 26-11-2022 14:33
Output of port stats on the router
tcp:
	1559 packets sent
		392 data packets (190411 bytes)
		2 data packets (125 bytes) retransmitted
		1 data packet unnecessarily retransmitted
		0 resends initiated by MTU discovery
		756 ack-only packets (0 delayed)
		0 URG only packets
		0 window probe packets
		0 window update packets
		409 control packets
	1604 packets received
		607 acks (for 189099 bytes)
		68 duplicate acks
		0 acks for unsent data
		485 packets (330662 bytes) received in-sequence
		64 completely duplicate packets (46 bytes)
		0 old duplicate packets
		0 packets with some dup. data (0 bytes duped)
		0 out-of-order packets (0 bytes)
		0 packets (0 bytes) of data after window
		0 window probes
		0 window update packets
		68 packets received after close
		0 discarded for bad checksums
		0 discarded for bad header offset fields
		0 discarded because packet too short
		0 discarded due to full reassembly queue
	216 connection requests
	16 connection accepts
	0 bad connection attempts
	0 listen queue overflows
	0 ignored RSTs in the windows
	201 connections established (including accepts)
		46 times used RTT from hostcache
		46 times used RTT variance from hostcache
		0 times used slow-start threshold from hostcache
	236 connections closed (including 11 drops)
		43 connections updated cached RTT on close
		43 connections updated cached RTT variance on close
		0 connections updated cached ssthresh on close
	0 embryonic connections dropped
	586 segments updated rtt (of 637 attempts)
	16 retransmit timeouts
		1 connection dropped by rexmit timeout
	0 persist timeouts
		0 connections dropped by persist timeout
	0 Connections (fin_wait_2) dropped because of timeout
	0 keepalive timeouts
		0 keepalive probes sent
		0 connections dropped by keepalive
	57 correct ACK header predictions
	279 correct data packet header predictions
	16 syncache entries added
		0 retransmitted
		0 dupsyn
		0 dropped
		16 completed
		0 bucket overflow
		0 cache overflow
		0 reset
		0 stale
		0 aborted
		0 badack
		0 unreach
		0 zone failures
	16 cookies sent
	0 cookies received
	26 hostcache entries added
		0 bucket overflow
	0 SACK recovery episodes
	0 segment rexmits in SACK recovery episodes
	0 byte rexmits in SACK recovery episodes
	4 SACK options (SACK blocks) received
	46 SACK options (SACK blocks) sent
	0 SACK scoreboard overflow
	0 packets with ECN CE bit set
	0 packets with ECN ECT(0) bit set
	0 packets with ECN ECT(1) bit set
	0 successful ECN handshakes
	0 times ECN reduced the congestion window
	0 packets with matching signature received
	0 packets with bad signature received
	0 times failed to make signature due to no SA
	0 times unexpected signature received
	0 times no signature provided by segment
	0 Path MTU discovery black hole detection activations
	0 Path MTU discovery black hole detection min MSS activations
	0 Path MTU discovery black hole detection failures
TCP connection count by state:
	0 connections in CLOSED state
	5 connections in LISTEN state
	0 connections in SYN_SENT state
	0 connections in SYN_RCVD state
	1 connection  in ESTABLISHED state
	0 connections in CLOSE_WAIT state
	0 connections in FIN_WAIT_1 state
	0 connections in CLOSING state
	0 connections in LAST_ACK state
	1 connection  in FIN_WAIT_2 state
	0 connections in TIME_WAIT state
udp:
	789 datagrams received
	0 with incomplete header
	0 with bad data length field
	0 with bad checksum
	0 with no checksum
	7 dropped due to no socket
	2 broadcast/multicast datagrams undelivered
	0 dropped due to full socket buffers
	0 not for hashed pcb
	780 delivered
	798 datagrams output
	0 times multicast source filter matched
ip:
	2168594 total packets received
	0 bad header checksums
	0 with size smaller than minimum
	0 with data size < data length
	0 with ip length > max ip packet size
	0 with header length < data size
	0 with data length < header length
	0 with bad options
	0 with incorrect version number
	0 fragments received
	0 fragments dropped (dup or out of space)
	0 fragments dropped after timeout
	0 packets reassembled ok
	14786 packets for this host
	0 packets for unknown/unsupported protocol
	1295140 packets forwarded (474 packets fast forwarded)
	303 packets not forwardable
	0 packets received for unknown multicast group
	0 redirects sent
	15381 packets sent from this host
	0 packets sent with fabricated ip header
	52 output packets dropped due to no bufs, etc.
	4 output packets discarded due to no route
	0 output datagrams fragmented
	0 fragments created
	0 datagrams that can't be fragmented
	0 tunneling packets that can't find gif
	0 datagrams with bad address in header
icmp:
	0 calls to icmp_error
	0 errors not generated in response to an icmp message
	Output histogram:
		echo reply: 6342
		routing redirect: 526
	0 messages with bad code fields
	0 messages less than the minimum length
	0 messages with bad checksum
	0 messages with bad length
	0 multicast echo requests ignored
	0 multicast timestamp requests ignored
	Input histogram:
		echo reply: 6047
		destination unreachable: 4
		echo: 6342
	6342 message responses generated
	0 invalid return addresses
	0 no return routes
ipsec:
	0 inbound packets violated process security policy
	0 inbound packets failed due to insufficient memory
	0 invalid inbound packets
	0 outbound packets violated process security policy
	0 outbound packets with no SA available
	0 outbound packets failed due to insufficient memory
	0 outbound packets with no route available
	0 invalid outbound packets
	0 outbound packets with bundled SAs
	0 spd cache hits
	0 spd cache misses
	0 clusters copied during clone
	0 mbufs inserted during makespace
ah:
	0 packets shorter than header shows
	0 packets dropped; protocol family not supported
	0 packets dropped; no TDB
	0 packets dropped; bad KCR
	0 packets dropped; queue full
	0 packets dropped; no transform
	0 replay counter wraps
	0 packets dropped; bad authentication detected
	0 packets dropped; bad authentication length
	0 possible replay packets detected
	0 packets in
	0 packets out
	0 packets dropped; invalid TDB
	0 bytes in
	0 bytes out
	0 packets dropped; larger than IP_MAXPACKET
	0 packets blocked due to policy
	0 crypto processing failures
	0 tunnel sanity check failures
esp:
	0 packets shorter than header shows
	0 packets dropped; protocol family not supported
	0 packets dropped; no TDB
	0 packets dropped; bad KCR
	0 packets dropped; queue full
	0 packets dropped; no transform
	0 packets dropped; bad ilen
	0 replay counter wraps
	0 packets dropped; bad encryption detected
	0 packets dropped; bad authentication detected
	0 possible replay packets detected
	0 packets in
	0 packets out
	0 packets dropped; invalid TDB
	0 bytes in
	0 bytes out
	0 packets dropped; larger than IP_MAXPACKET
	0 packets blocked due to policy
	0 crypto processing failures
	0 tunnel sanity check failures
ipcomp:
	0 packets shorter than header shows
	0 packets dropped; protocol family not supported
	0 packets dropped; no TDB
	0 packets dropped; bad KCR
	0 packets dropped; queue full
	0 packets dropped; no transform
	0 replay counter wraps
	0 packets in
	0 packets out
	0 packets dropped; invalid TDB
	0 bytes in
	0 bytes out
	0 packets dropped; larger than IP_MAXPACKET
	0 packets blocked due to policy
	0 crypto processing failures
	0 packets sent uncompressed; size < compr. algo. threshold
	0 packets sent uncompressed; compression was useless
pim:
	0 messages received
	0 bytes received
	0 messages received with too few bytes
	0 messages received with bad checksum
	0 messages received with bad version
	0 data register messages received
	0 data register bytes received
	0 data register messages received on wrong iif
	0 bad registers received
	0 data register messages sent
	0 data register bytes sent
carp:
	0 packets received (IPv4)
	0 packets received (IPv6)
		0 packets discarded for wrong TTL
		0 packets shorter than header
		0 discarded for bad checksums
		0 discarded packets with a bad version
		0 discarded because packet too short
		0 discarded for bad authentication
		0 discarded for bad vhid
		0 discarded because of a bad address list
	0 packets sent (IPv4)
	0 packets sent (IPv6)
		0 send failed due to mbuf memory error
pfsync:
	0 packets received (IPv4)
	0 packets received (IPv6)
		0 clear all requests received
		0 state inserts received
		0 state inserted acks received
		0 state updates received
		0 compressed state updates received
		0 uncompressed state requests received
		0 state deletes received
		0 compressed state deletes received
		0 fragment inserts received
		0 fragment deletes received
		0 bulk update marks received
		0 TDB replay counter updates received
		0 end of frame marks received
		/0 packets discarded for bad interface
		0 packets discarded for bad ttl
		0 packets shorter than header
		0 packets discarded for bad version
		0 packets discarded for bad HMAC
		0 packets discarded for bad action
		0 packets discarded for short packet
		0 states discarded for bad values
		0 stale states
		0 failed state lookup/inserts
	0 packets sent (IPv4)
	0 packets sent (IPv6)
		0 clear all requests sent
		0 state inserts sent
		0 state inserted acks sent
		0 state updates sent
		0 compressed state updates sent
		0 uncompressed state requests sent
		0 state deletes sent
		0 compressed state deletes sent
		0 fragment inserts sent
		0 fragment deletes sent
		0 bulk update marks sent
		0 TDB replay counter updates sent
		0 end of frame marks sent
		0 failures due to mbuf memory error
		0 send errors
arp:
	337 ARP requests sent
	2 ARP replies sent
	2 ARP requests received
	73 ARP replies received
	75 ARP packets received
	527 total packets dropped due to no ARP entry
	88 ARP entrys timed out
	0 Duplicate IPs seen
ip6:
	3 total packets received
	0 with size smaller than minimum
	0 with data size < data length
	0 with bad options
	0 with incorrect version number
	0 fragments received
	0 fragments dropped (dup or out of space)
	0 fragments dropped after timeout
	0 fragments that exceeded limit
	0 atomic fragments
	0 packets reassembled ok
	3 packets for this host
	0 packets forwarded
	0 packets not forwardable
	0 redirects sent
	17 packets sent from this host
	0 packets sent with fabricated ip header
	0 output packets dropped due to no bufs, etc.
	545 output packets discarded due to no route
	0 output datagrams fragmented
	0 fragments created
	0 datagrams that can't be fragmented
	0 packets that violated scope rules
	3 multicast packets which we don't join
	Input histogram:
		ICMP6: 3
	Mbuf statistics:
		3 one mbuf
		0 one ext mbuf
		0 two or more ext mbuf
	0 packets whose headers are not contiguous
	0 tunneling packets that can't find gif
	0 packets discarded because of too many headers
	0 failures of source address selection
	source addresses on an outgoing I/F
		3 link-locals
	source addresses of a different scope
		3 link-locals
	Source addresses selection rule applied:
		3 first candidate
icmp6:
	0 calls to icmp6_error
	0 errors not generated in response to an icmp6 message
	0 errors not generated because of rate limitation
	Output histogram:
		router solicitation: 3
		neighbor solicitation: 3
		MLDv2 listener report: 11
	0 messages with bad code fields
	0 messages < minimum length
	0 bad checksums
	0 messages with bad length
	Histogram of error messages to be generated:
		0 no route
		0 administratively prohibited
		0 beyond scope
		0 address unreachable
		0 port unreachable
		0 packet too big
		0 time exceed transit
		0 time exceed reassembly
		0 erroneous header field
		0 unrecognized next header
		0 unrecognized option
		0 redirect
		0 unknown
	0 message responses generated
	0 messages with too many ND options
	0 messages with bad ND options
	0 bad neighbor solicitation messages
	0 bad neighbor advertisement messages
	0 bad router solicitation messages
	0 bad router advertisement messages
	0 bad redirect messages
	0 path MTU changes
ipsec6:
	0 inbound packets violated process security policy
	0 inbound packets failed due to insufficient memory
	0 invalid inbound packets
	0 outbound packets violated process security policy
	0 outbound packets with no SA available
	0 outbound packets failed due to insufficient memory
	0 outbound packets with no route available
	0 invalid outbound packets
	0 outbound packets with bundled SAs
	0 spd cache hits
	0 spd cache misses
	0 clusters copied during clone
	0 mbufs inserted during makespace
rip6:
	0 messages received
	0 checksum calculations on inbound
	0 messages with bad checksum
	0 messages dropped due to no socket
	0 multicast messages dropped due to no socket
	0 messages dropped due to full socket buffers
	0 delivered
	0 datagrams output
pfkey:
	0 requests sent from userland
	0 bytes sent from userland
	0 messages with invalid length field
	0 messages with invalid version field
	0 messages with invalid message type field
	0 messages too short
	0 messages with memory allocation failure
	0 messages with duplicate extension
	0 messages with invalid extension type
	0 messages with invalid sa type
	0 messages with invalid address extension
	0 requests sent to userland
	0 bytes sent to userland
	0 messages toward single socket
	0 messages toward all sockets
	0 messages toward registered sockets
	0 messages with memory allocation failure
- Mark as New
- Bookmark this message
- Subscribe to this message
- Mute
- Subscribe to this message's RSS feed
- Highlight this message
- Print this message
- Flag for a moderator
on 26-11-2022 14:38
I've just realised that the time of no packet loss is when I'm uploading a substantial amount (nightly backup from NAS to Azure) which both explains why it's that time but doesn't help with the bigger problem.
Your backup task Microsoft Azure 1 is now complete.
Backup Task: Microsoft Azure 1
Backup Destination: xxxxxx / xxxxxxx_1.hbk
Start Time: Sat, Nov 26 2022 02:20:01
Duration: 2 Hour 15 Minute 55 Second
- Mark as New
- Bookmark this message
- Subscribe to this message
- Mute
- Subscribe to this message's RSS feed
- Highlight this message
- Print this message
- Flag for a moderator
26-11-2022 15:03 - edited 26-11-2022 15:04
Re the BQM - it looks as if the packet drops are caused by whatever you have connected to the Hub on ethernet cables. Try changing to new Cat6a cables first - this will protect against crosstalk in the connections and electrical interference. Then add the devices back one by one (hour or two apart) until the red fringe reappears - and then that identifies where the problem lays
Re the "sea of red" - when you move from modem to router mode and vice versa, your i.p. address changes. Hence the red sea upon that change. So you need to set up two BQM's - one for each IP address.
--------------------
John
--------------------
I do not work for VM. My services: HD TV on VIP (+ Sky Sports & Movies & BT sport), x3 V6 boxes (1 wired, 2 on WiFi) Hub5 in modem mode with Apple Airport Extreme Router +2 Airport Express's & TP-Link Archer C64 WAP. On Volt 350Mbps, Talk Anytime Phone, x2 Mobile SIM only iPhones.
- Mark as New
- Bookmark this message
- Subscribe to this message
- Mute
- Subscribe to this message's RSS feed
- Highlight this message
- Print this message
- Flag for a moderator
on 28-11-2022 19:44
Many apologies for the issues faced Fastdruid,
Welcome back to the community.
Just from checking our service I can't see any readings that would attribute to the problems faced.
Are you still facing the same issues?
Let us know,
- Mark as New
- Bookmark this message
- Subscribe to this message
- Mute
- Subscribe to this message's RSS feed
- Highlight this message
- Print this message
- Flag for a moderator
on 28-11-2022 19:54
Yes. I'm still none the wiser as to why the packet loss drops in the middle of the night when there is significant outbound traffic but having tried an entirely different old Netgear router with all the same physical cables (which didn't exhibit the issue) my only theory at this point is that the port itself on the router has partly failed or there is something otherwise "wrong" with it.
As it's 8 years old I figure I'll upgrade to a newer device and also try re-formatting it and re-installing pfSense.
- Mark as New
- Bookmark this message
- Subscribe to this message
- Mute
- Subscribe to this message's RSS feed
- Highlight this message
- Print this message
- Flag for a moderator
28-11-2022 22:01 - edited 28-11-2022 22:02
Change the cable from hub to router and instead of a router connect a PC to the hub in modem mode with a new BQM allowed by firewall
does the hub upstream status show any T# timeouts or QAM dropping from 64?
- Mark as New
- Bookmark this message
- Subscribe to this message
- Mute
- Subscribe to this message's RSS feed
- Highlight this message
- Print this message
- Flag for a moderator
on 28-11-2022 22:32
With an entirely different router, no packet loss. With this one, there is.
Upstream status, one T3 timeout.
1 39399888 51 5120 64 qam 4
2 25800156 51 5120 64 qam 6
3 32600073 51 5120 64 qam 5
4 46199976 51 5120 64 qam 3
Upstream bonded channels
Channel Channel Type T1 Timeouts T2 Timeouts T3 Timeouts T4 Timeouts
1 ATDMA 0 0 1 0
2 ATDMA 0 0 0 0
3 ATDMA 0 0 0 0
4 ATDMA 0 0 0 0
- Mark as New
- Bookmark this message
- Subscribe to this message
- Mute
- Subscribe to this message's RSS feed
- Highlight this message
- Print this message
- Flag for a moderator
on 01-12-2022 12:20
Thank you for the update @Fastdruid
I have had a look into this again and I can see you may be having issues with your hub power levels and hub data. To best resolve this, I have sent a private message. Please look out for the purple envelope and provide a response when you can.
Thanks,
- Mark as New
- Bookmark this message
- Subscribe to this message
- Mute
- Subscribe to this message's RSS feed
- Highlight this message
- Print this message
- Flag for a moderator
on 14-12-2022 12:02
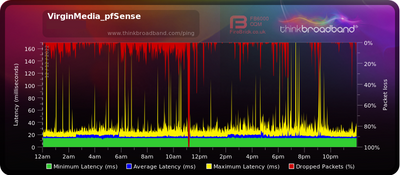
Right. So I've replaced the router. It has improved things... but not fixed it.
The big spike is the replacement.
